• Economy
  • Investing
Long Distance Investing
  • Stock
  • Editor’s Pick
Stock

S&P 500 and Nasdaq: S&P 500 has resistance at 5860.0 zone

by October 23, 2024
written by October 23, 2024

S&P 500 and Nasdaq: S&P 500 has resistance at 5860.0 zone

The EMA 200 moving average proved to be excellent support for the S&P 500 index on Tuesday, October 22
Nasdaq managed to climb to a new weekly high at 20455.8 level

S&P 500 chart analysis

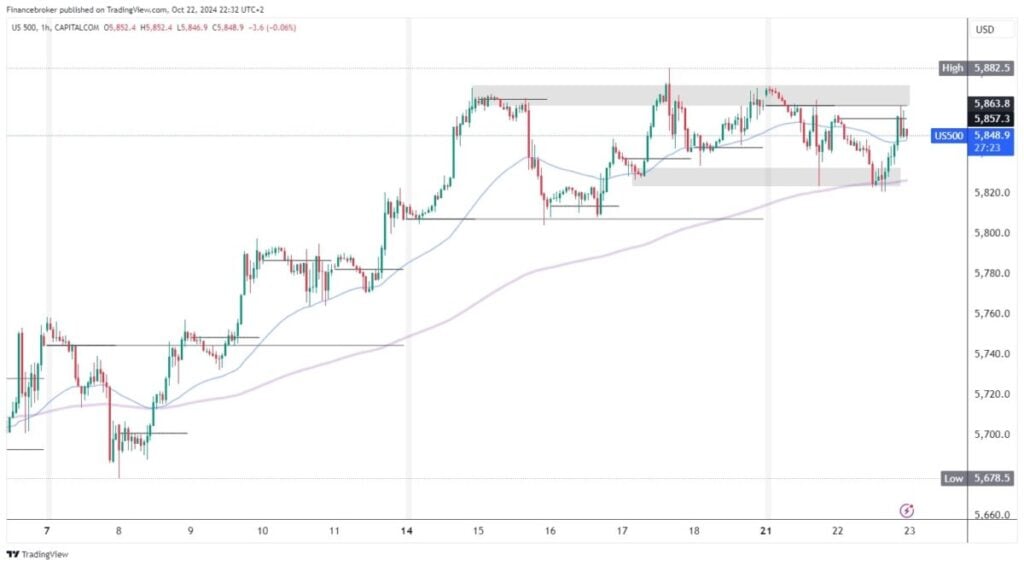
The EMA 200 moving average proved to be excellent support for the S&P 500 index on Tuesday, October 22. After support at the 5820.0 level, we saw the initiation of a bullish consolidation back to the daily open level of 5857.3. We even tested the weekly open level of 5863.8 but failed to hold on to that zone. The index again turned to the bearish side and retreated to 5845.0 levels. Here, we test the EMA 500 moving average.

Potential lower targets are 5840.0 and 5830.0 levels. If we get support from the EMA 50 moving average, the S&P 500 has a new opportunity to return above the daily open level and test today’s resistance in the 5865.0 zone. We need to stay there for further recovery on the bullish side. Potential higher targets are 5870.0 and 5880.0 levels.


Nasdaq chart analysis

Nasdaq managed to climb to a new weekly high at 20455.8 level. After three days, the index broke the resistance at the 20400.0 level. Although we did not stay above for long, the breakout is a good indicator that the Nasdaq has pretensions to move back to the bullish side. Potential higher targets are 20475.0 and 20500.0 levels.

For a bearish option, we need a pullback below the 20300.0 level. With that step, the index moves below the weekly open level to the negative side. After that, pressure builds for a further pullback to 20250.0 and the EMA 200 moving average. This week, the moving average managed to hold the price above on the positive side and produce a bullish consolidation in the previous two cases. This time, we hope for a breakout below and a new daily low formation. Potential lower targets are 20225.0 and 20000.0 levels.


The post S&P 500 and Nasdaq: S&P 500 has resistance at 5860.0 zone appeared first on FinanceBrokerage.
0 comment
0
FacebookTwitterPinterestEmail

previous post
Gold and silver: the bullish trend continues for gold
next post
Bitcoin is losing its bullish momentum in the last two days

You may also like

Buy Bitcoin Under $100K Before The Next Bull...

April 22, 2025

Trump’s Fed Criticism Sparks Investor Concerns

April 22, 2025

Oil Prices Rebound After Trump’s Criticism of Powell

April 22, 2025

BNB Price Surge Leads Crypto Gains as Bitcoin...

April 21, 2025

Fed’s Stagflation Warning Impacts Crypto Markets

April 21, 2025

Gold Price Surge Hits $3,385 Amid Trade Tensions

April 21, 2025

Bitcoin Rebounds to $83,404 Amid Renewed Investor Confidence

April 21, 2025

Kraken Rolls Out Commission-Free Stock Trading

April 21, 2025

Bitcoin Nears $85K Amid Market Optimism

April 21, 2025

Bitcoin Slips to $83.6K Amid Nvidia’s $5.5B Charge

April 21, 2025

    Stay updated with the latest news, exclusive offers, and special promotions. Sign up now and be the first to know! As a member, you'll receive curated content, insider tips, and invitations to exclusive events. Don't miss out on being part of something special.


    By opting in you agree to receive emails from us and our affiliates. Your information is secure and your privacy is protected.

    Recent Posts

    • KORE, Robo, Ericsson, and Winnebago Redefine the Open Road with Winnebago Connect™

      May 13, 2025
    • Skylo Drives Into Automotive Sector With BMW Group, Deutsche Telekom, Qualcomm, HARMAN, Fraunhofer IIS, Cubic³, and Others

      May 13, 2025
    • The Ideal Energy Storage Solution for Bluetooth Thermometers: YMIN’s Supercapacitor

      May 13, 2025
    • How IoT Businesses Can Engage Customers Through Conversational Search

      May 13, 2025

    Categories

    • Economy (683)
    • Editor's Pick (352)
    • Investing (4,555)
    • Stock (820)
    • About us
    • Contact us
    • Privacy Policy
    • Terms & Conditions

    Disclaimer: Longdistanceinvestings.com, its managers, its employees, and assigns (collectively “The Company”) do not make any guarantee or warranty about what is advertised above. Information provided by this website is for research purposes only and should not be considered as personalized financial advice. The Company is not affiliated with, nor does it receive compensation from, any specific security. The Company is not registered or licensed by any governing body in any jurisdiction to give investing advice or provide investment recommendation. Any investments recommended here should be taken into consideration only after consulting with your investment advisor and after reviewing the prospectus or financial statements of the company.


    Copyright © 2025 Longdistanceinvestings.com

    Long Distance Investing
    • Economy
    • Investing
    Long Distance Investing
    • Stock
    • Editor’s Pick